

--telemetry flag enables detailed usage monitoring and analytics tracking.
Quick Start
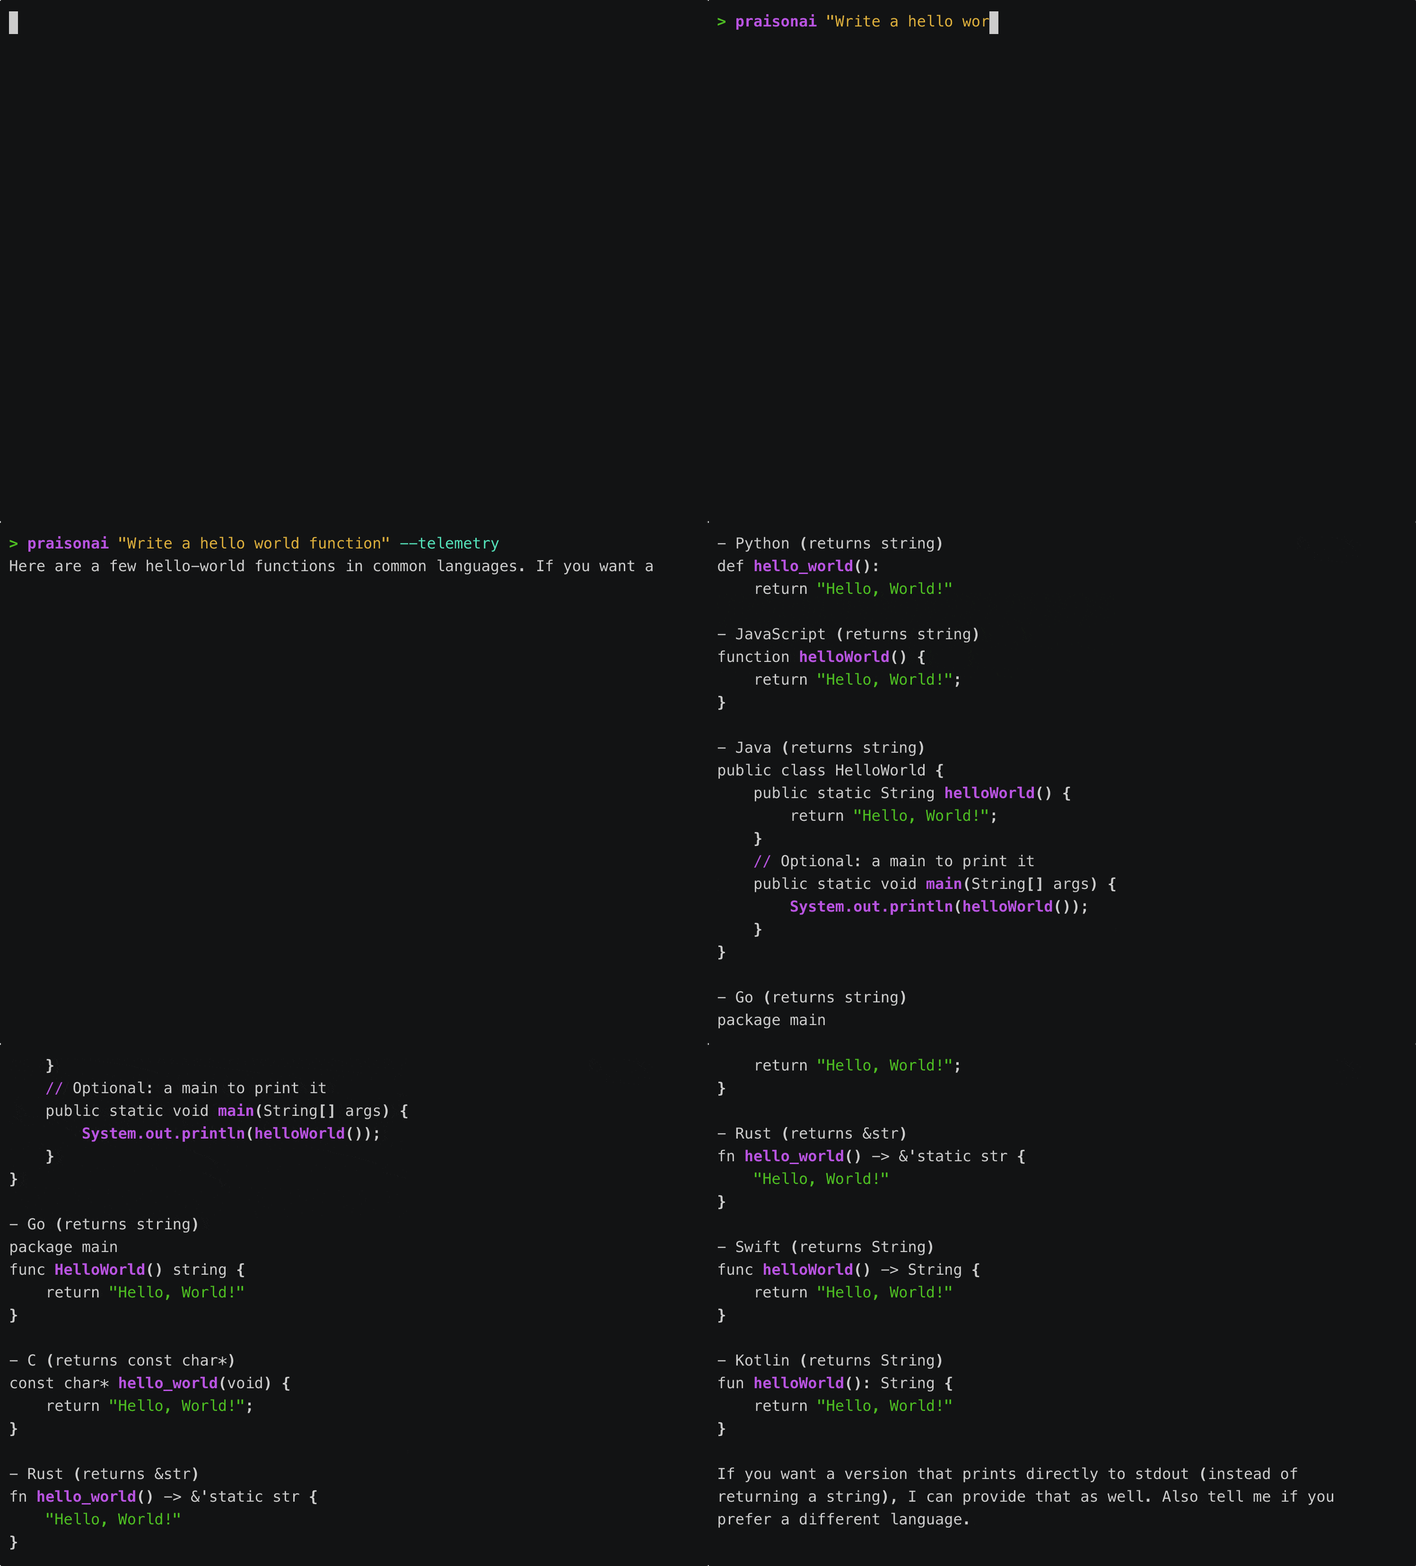
Usage
Basic Telemetry
Combine with Metrics
Telemetry Data Collected
Use Cases
Performance Monitoring
Track execution times across different tasks:Debugging
Identify issues in agent execution:Usage Analytics
Track patterns over time:Privacy & Data
Telemetry data is used to improve PraisonAI and is handled according to our privacy policy. No prompt content or sensitive data is collected.
What’s Collected
- ✅ Execution metrics (duration, token counts)
- ✅ Error types and frequencies
- ✅ Feature usage patterns
- ✅ Model selection statistics
What’s NOT Collected
- ❌ Prompt content
- ❌ Response content
- ❌ API keys or credentials
- ❌ Personal information
Disable Telemetry
To disable telemetry globally:Best Practices
Development
Enable telemetry during development to catch performance issues early
Production
Use telemetry to monitor production deployments and track SLAs
Debugging
Combine with
-v verbose flag for detailed debugging informationCost Tracking
Pair with
--metrics for complete cost and performance visibility